Patient-Reported Outcomes as Prognostic Indicators for Overall Survival in Cancer
Systematic Review & Meta-analysis — JAMA Oncology 2025
Published September 11, 2025 — JAMA Oncology
🧩 Can PROs Predict Survival?
Prognosis usually relies on stage, labs, imaging. Yet patient-reported outcomes (PROs)—covering symptoms, quality of life, functional status— provide independent and additive prognostic value for overall survival.
📋 What Are PROs?
Health data reported directly by patients: symptoms, QoL, functional capacity, daily activities. Captures the patient’s perspective beyond clinician-rated scales.
- Tablet/Kiosk at intake
- Mobile apps (daily/weekly check-ins)
- SMS/Email short forms w/ reminders
- Web portals for QoL & adverse events
Typical cadence: baseline, each visit, and every 1–4 weeks.
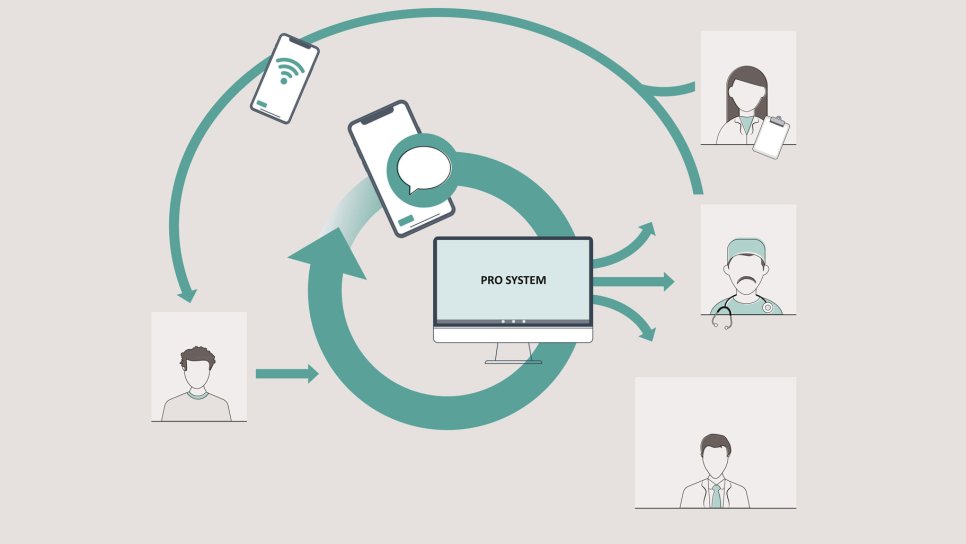
🧠 How ePROs Are Used
In trials, PROs quantify treatment impact. In clinics, they act as an early-warning system to trigger supportive care and timely interventions.
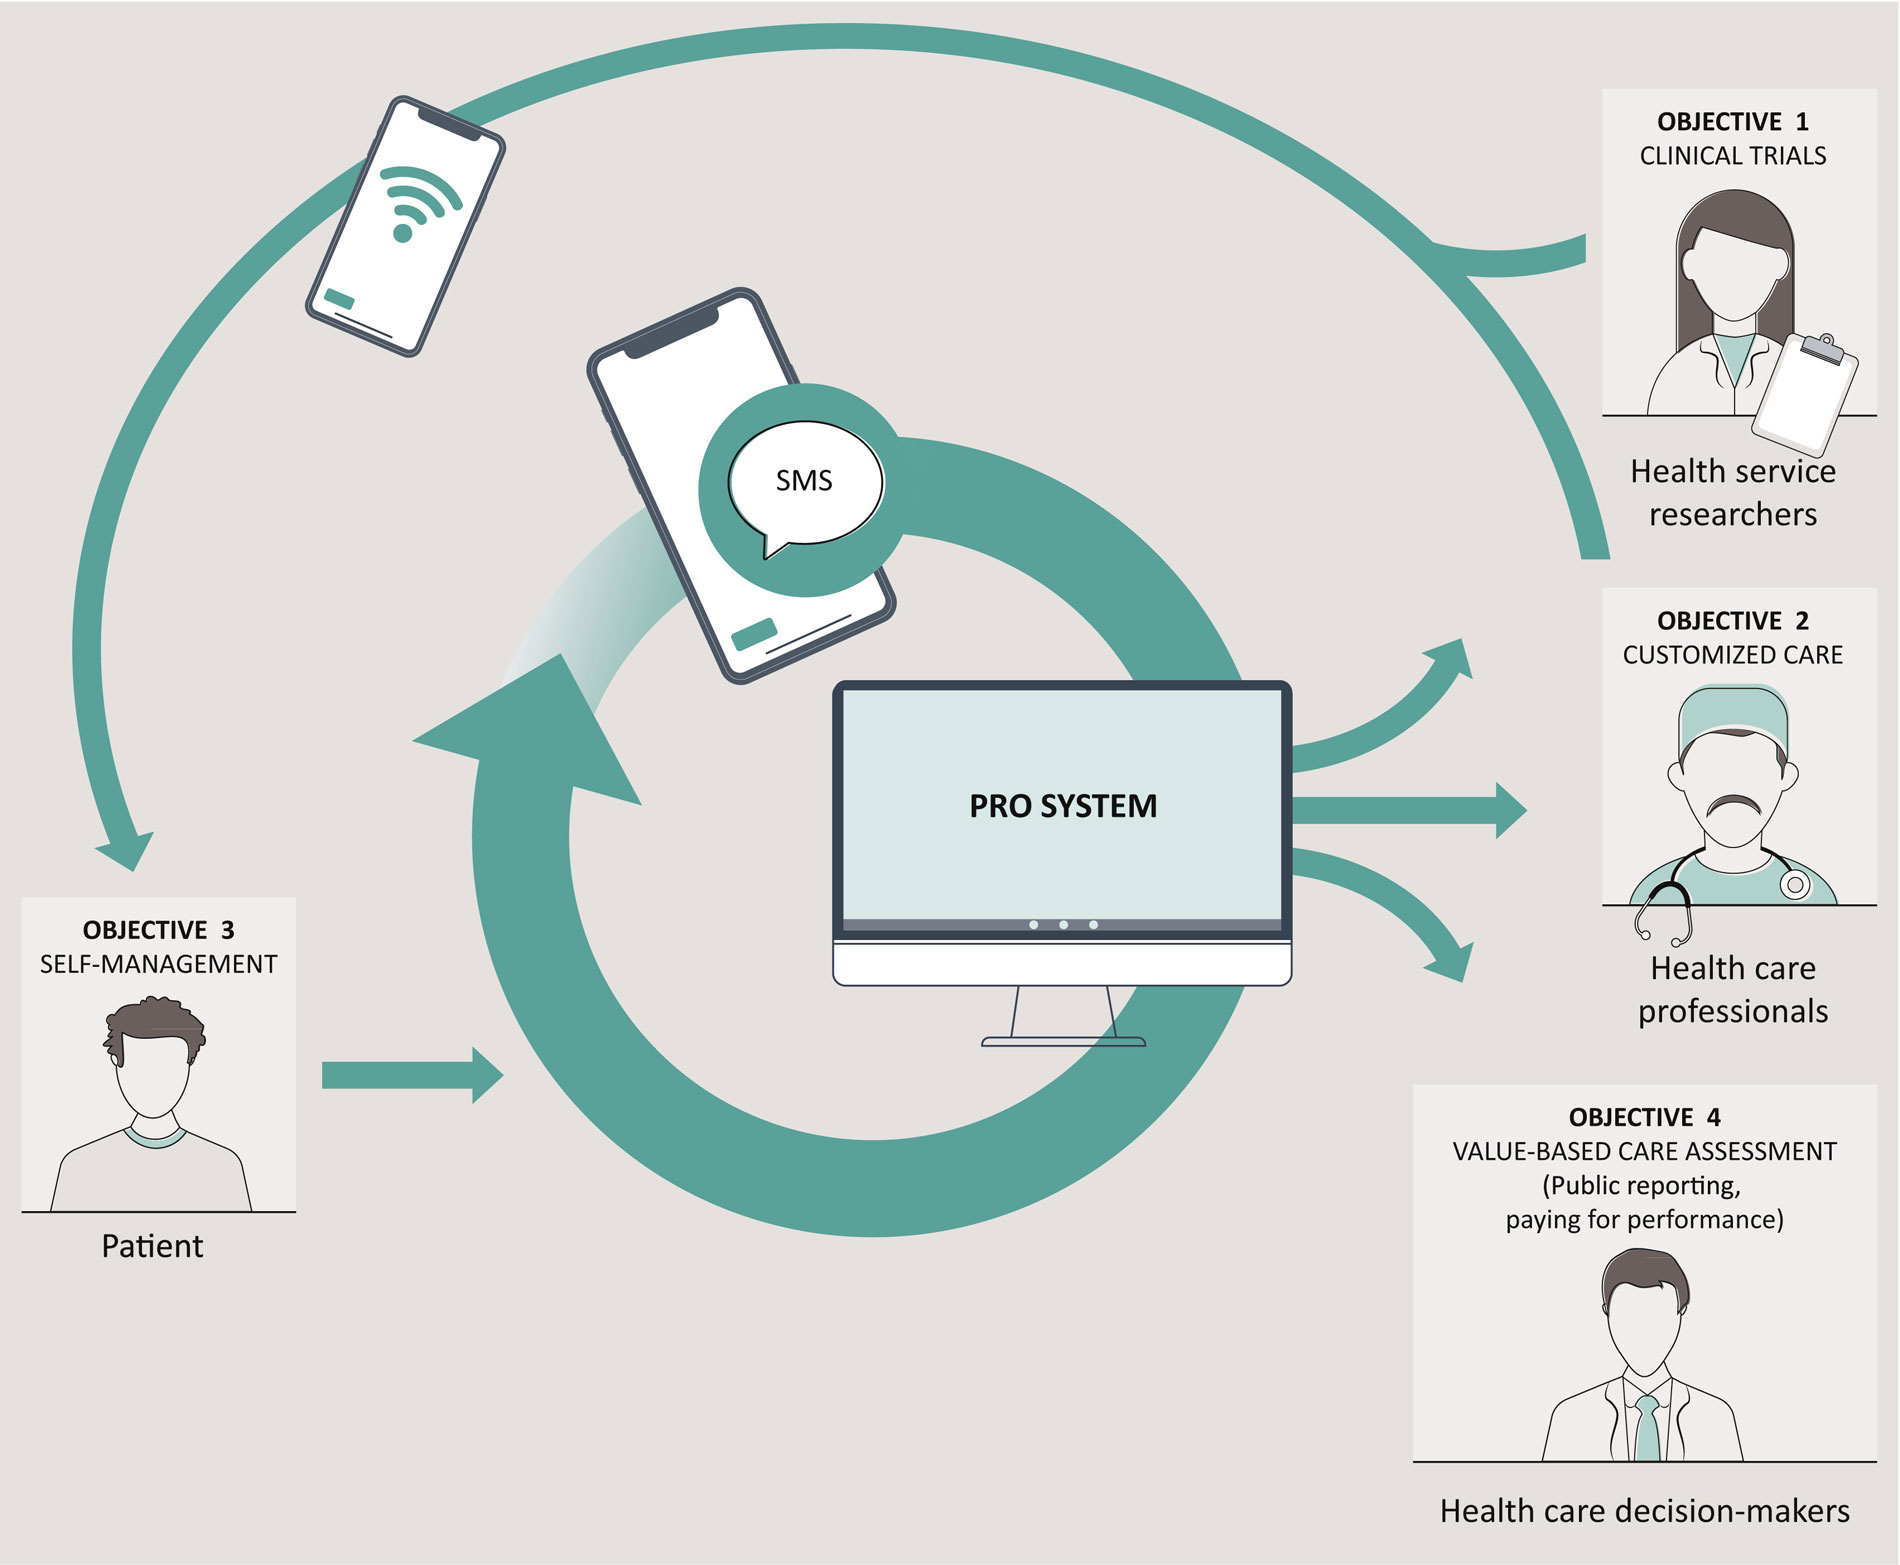
Figure: Patients submit ePROs → central PRO system → alerts & dashboards for the care team.
🚀 Quick Summary
- Global Health/QoL: each +1 point → ~1% lower mortality (HR 0.99)
- Symptoms linked with poorer OS: Nausea/vomiting (HR 1.12), pain (1.07), fatigue (1.05), appetite loss (1.04), dyspnea (1.03)
🧪 Methods — Evidence Base
- Design: Systematic review of RCTs (2000–2024); meta-analysis of 31 studies
- Population: Adults; major types: lung (20%), head & neck (12%), pancreas (12%), colorectal (10%), prostate (10%)
- Measures: Baseline PROs (incl. EORTC QLQ-C30); outcome: overall survival (OS)
- Stats: Multivariable adjustment; random-effects pooling; Egger’s test (no significant bias)
📊 Key Findings — Hazard Ratios & Interpretation
| PRO Domain | Pooled HR (95% CI) | Clinical Meaning |
|---|---|---|
| Physical functioning | 0.94 (0.92–0.96) | Higher scores → ~6% lower mortality |
| Role functioning | 0.96 (0.94–0.98) | Maintaining roles correlates with better OS |
| Global health / QoL | 0.99 (0.98–0.99) | Each +1 point → ~1% lower mortality |
| Nausea / vomiting | 1.12 (1.04–1.21) | Higher severity ↑ risk (~+12%) |
| Pain | 1.07 (1.04–1.11) | Uncontrolled pain ↔ worse OS |
| Fatigue | 1.05 (1.00–1.10) | Severe fatigue = higher mortality |
| Appetite loss | 1.04 | Likely via malnutrition effect |
| Dyspnea | 1.03 | Symptom control is critical |
| Constipation / Insomnia | — | No significant association |
🎯 Clinical Implications — PROs as “Missing Variables”
At similar disease stages, patients with stronger baseline physical/role function often live longer. Integrate PROs into risk stratification & decision-support.
High symptom scores → early supportive care (nutrition, PT, pain)
Embed baseline PRO panels & auto-alerts in EHR dashboards
Stratify & adapt monitoring using PRO-defined risk
🛠️ Five Practical Implementation Steps
- Baseline screening: EORTC QLQ-C30 short form at first visit
- Thresholds: Physical/role <50 → early referrals (nutrition, PT, pain clinic)
- Digital monitoring: Monthly SMS/app surveys + automated call reminders
- Dashboards: Highlight “PRO red flags” (↑ pain, ↑ nausea, ↑ fatigue)
- Reporting: Add PRO trend graphs to every visit summary (with before/after views)
⚠️ Limitations
- Heterogeneity in designs, populations, cancer types
- RCT cohorts may be more selective than real-world
- “Strongest” PRO predictor not rankable (overlapping CIs)
🔭 Future Perspective
The fusion of biology + patient experience is the next standard in oncology. PRO-driven tools will sharpen survival prediction and strengthen patient-centered care.
Reference: Huang RS et al., JAMA Oncology, online Sept 11, 2025. DOI: 10.1001/jamaoncol.2025.3153.